Why Penobscot
The Penobscot dataset contains both a 3D seismic volume and a set of 2D seismic lines acquired over the same area with comparable acquisition. Real 2D lines, real wavelet, real noise — and a real 3D ground truth to validate against.
That combination is rare. It lets us answer one specific question: given sparse 2D picks of a horizon, can we reconstruct the 3D surface, and how well do our uncertainty estimates match the actual error?
The workflow
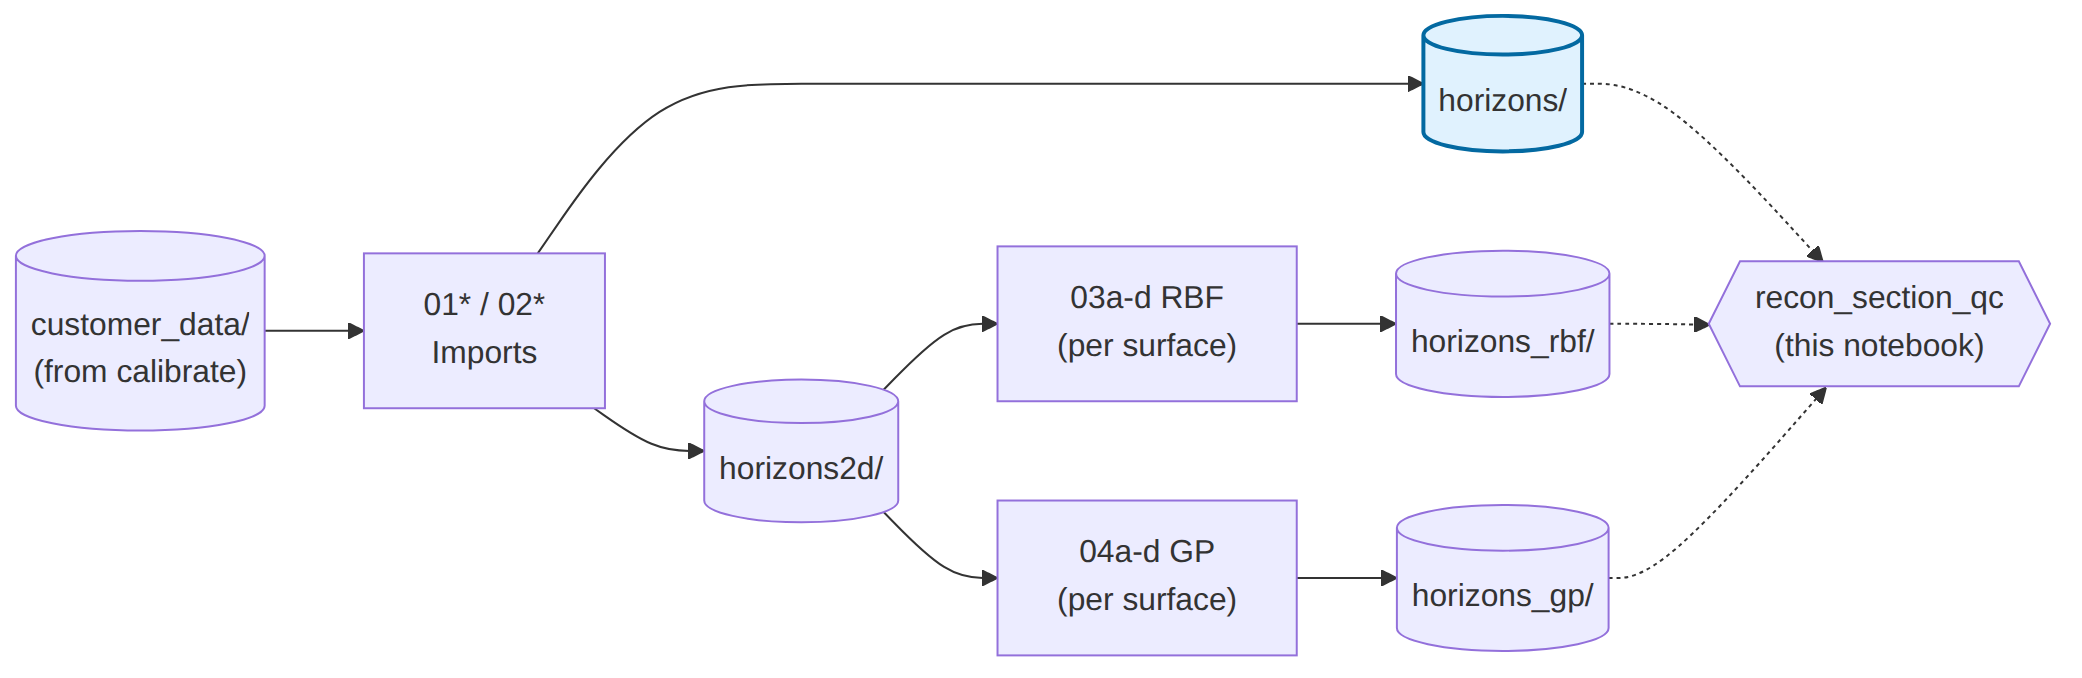
The reconstruction starts from 2D horizon picks delivered by the calibration project. Each surface is reconstructed two ways — by RBF (the classical smooth prior) and by GP regression (which produces both a mean estimate and a posterior covariance). This QC notebook then compares both reconstructions against the held-out 3D ground truth.
Section-view comparison
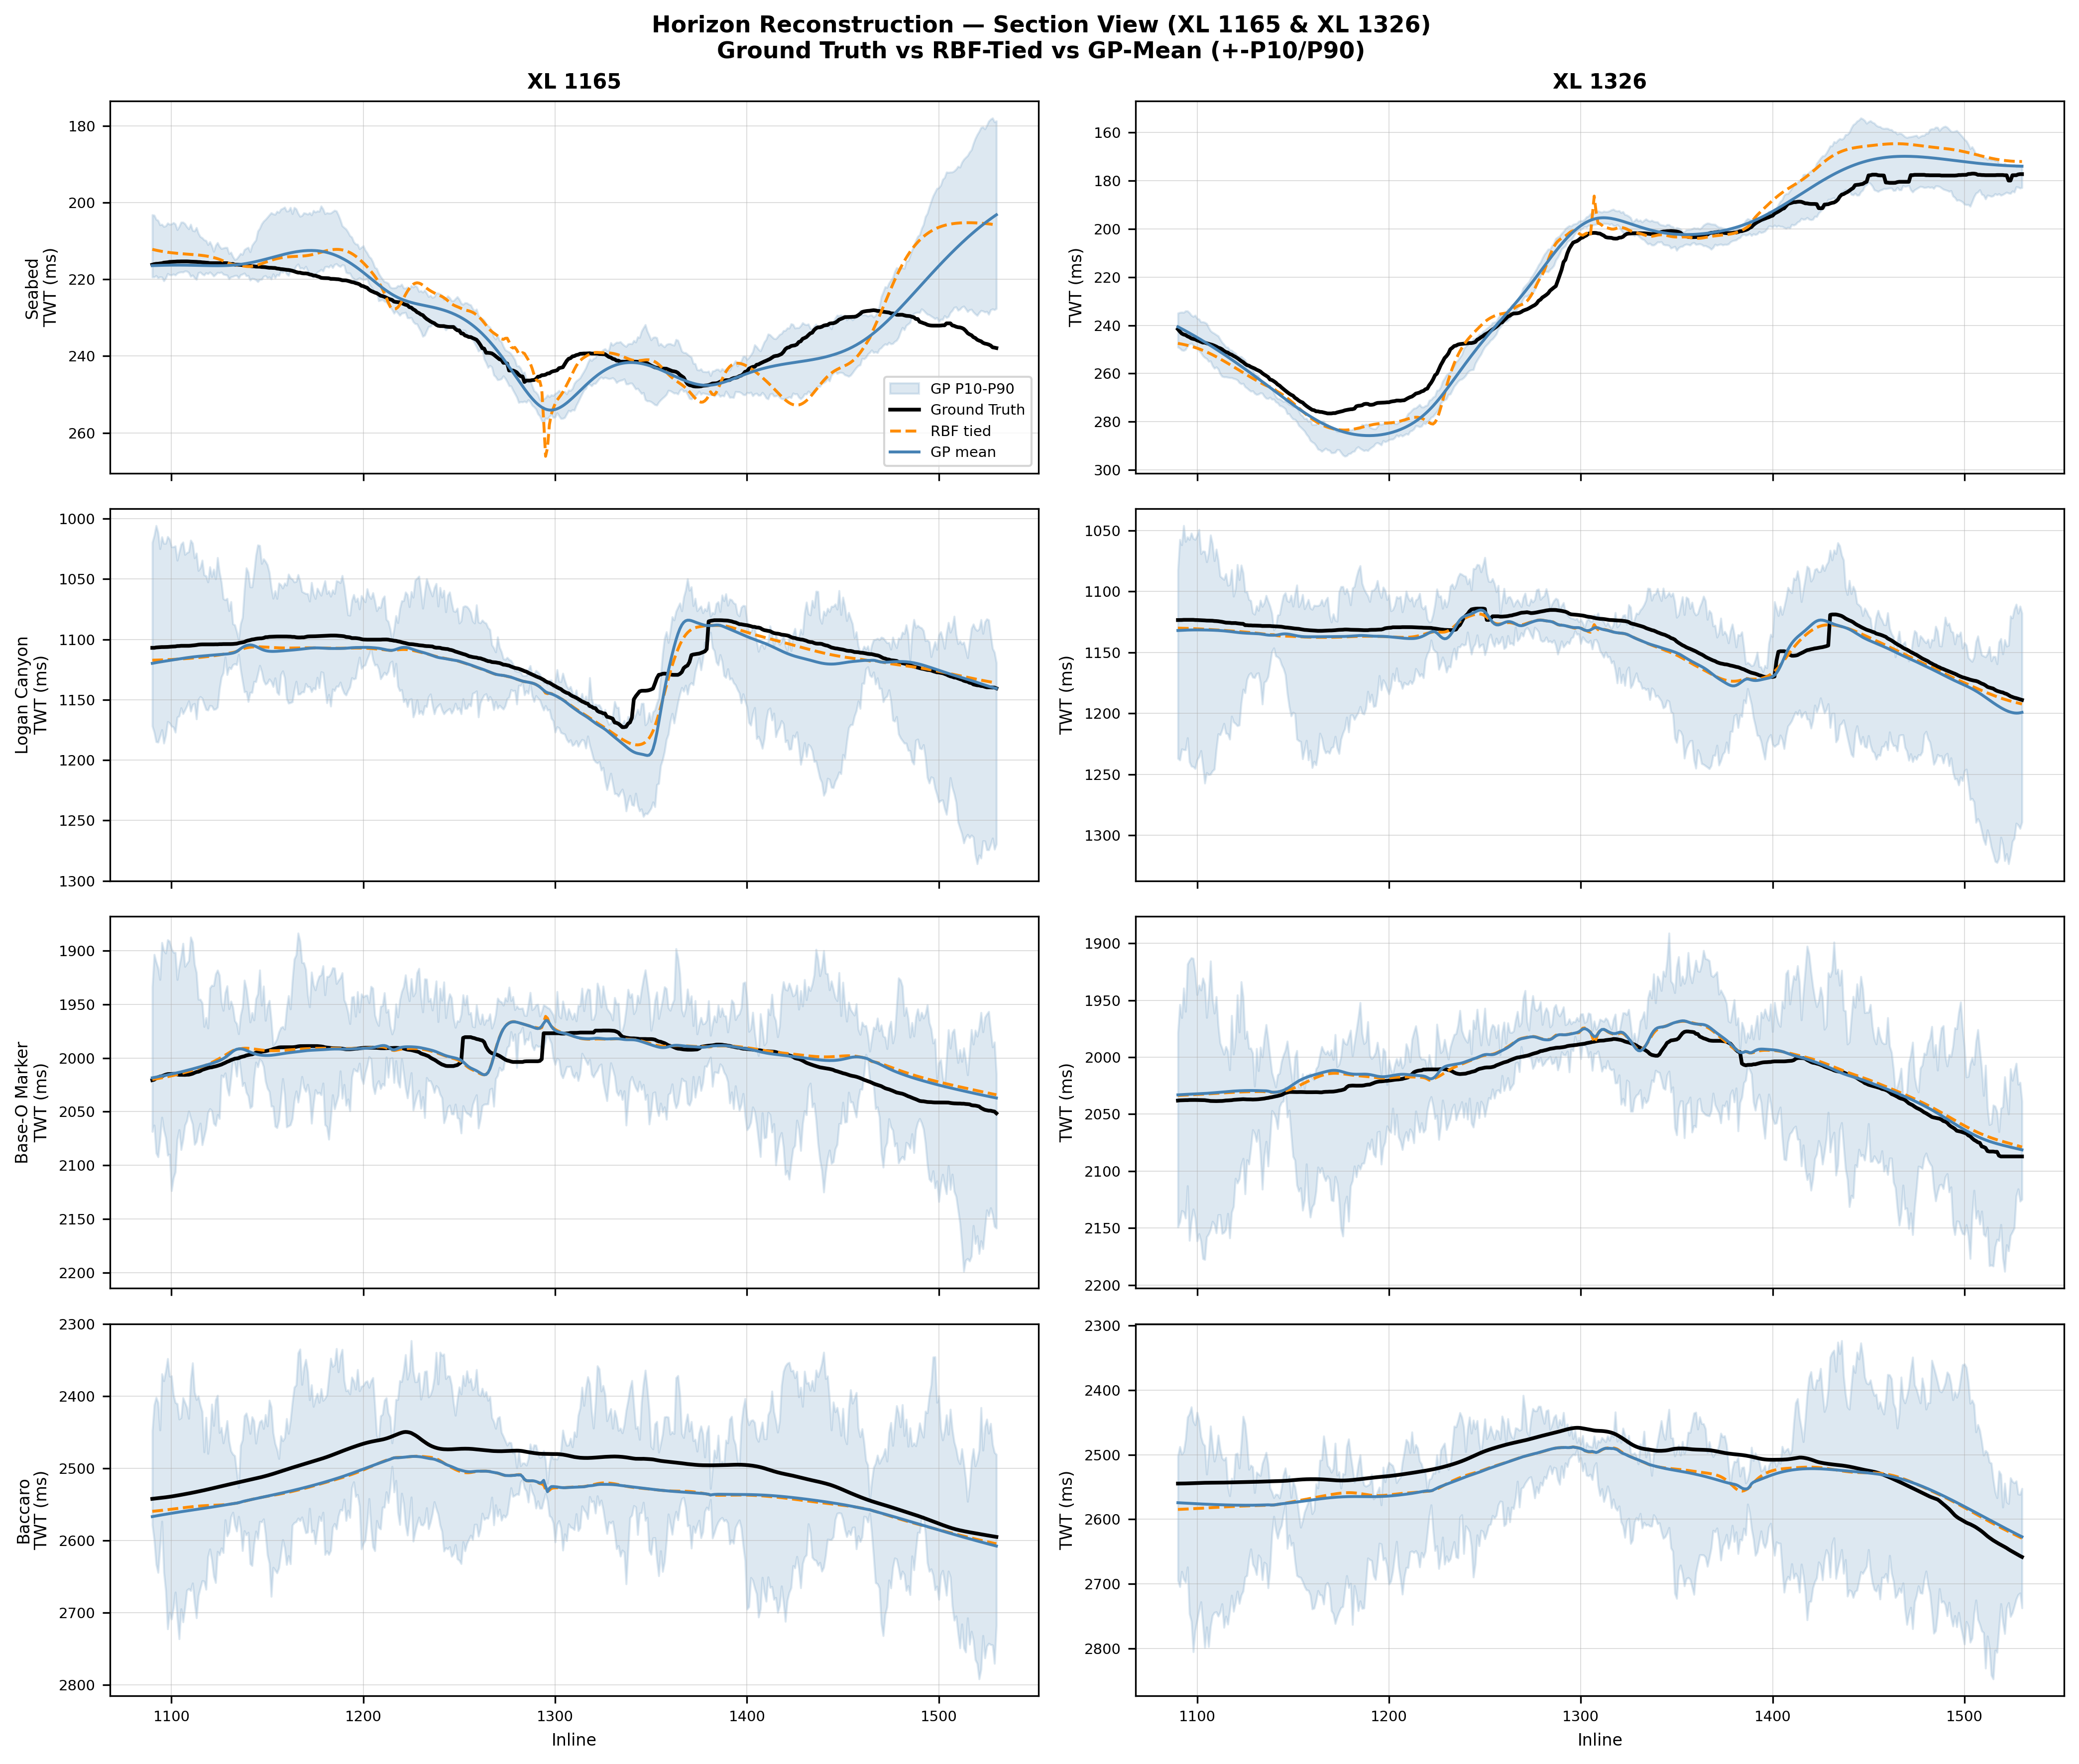
The headline visual: ground truth versus both reconstruction methods, on two held-out crosslines and four reconstructed horizons. The GP P10–P90 envelope is visible as light blue shading around the GP mean — narrow at line locations, wider between lines.
Plan-view comparison
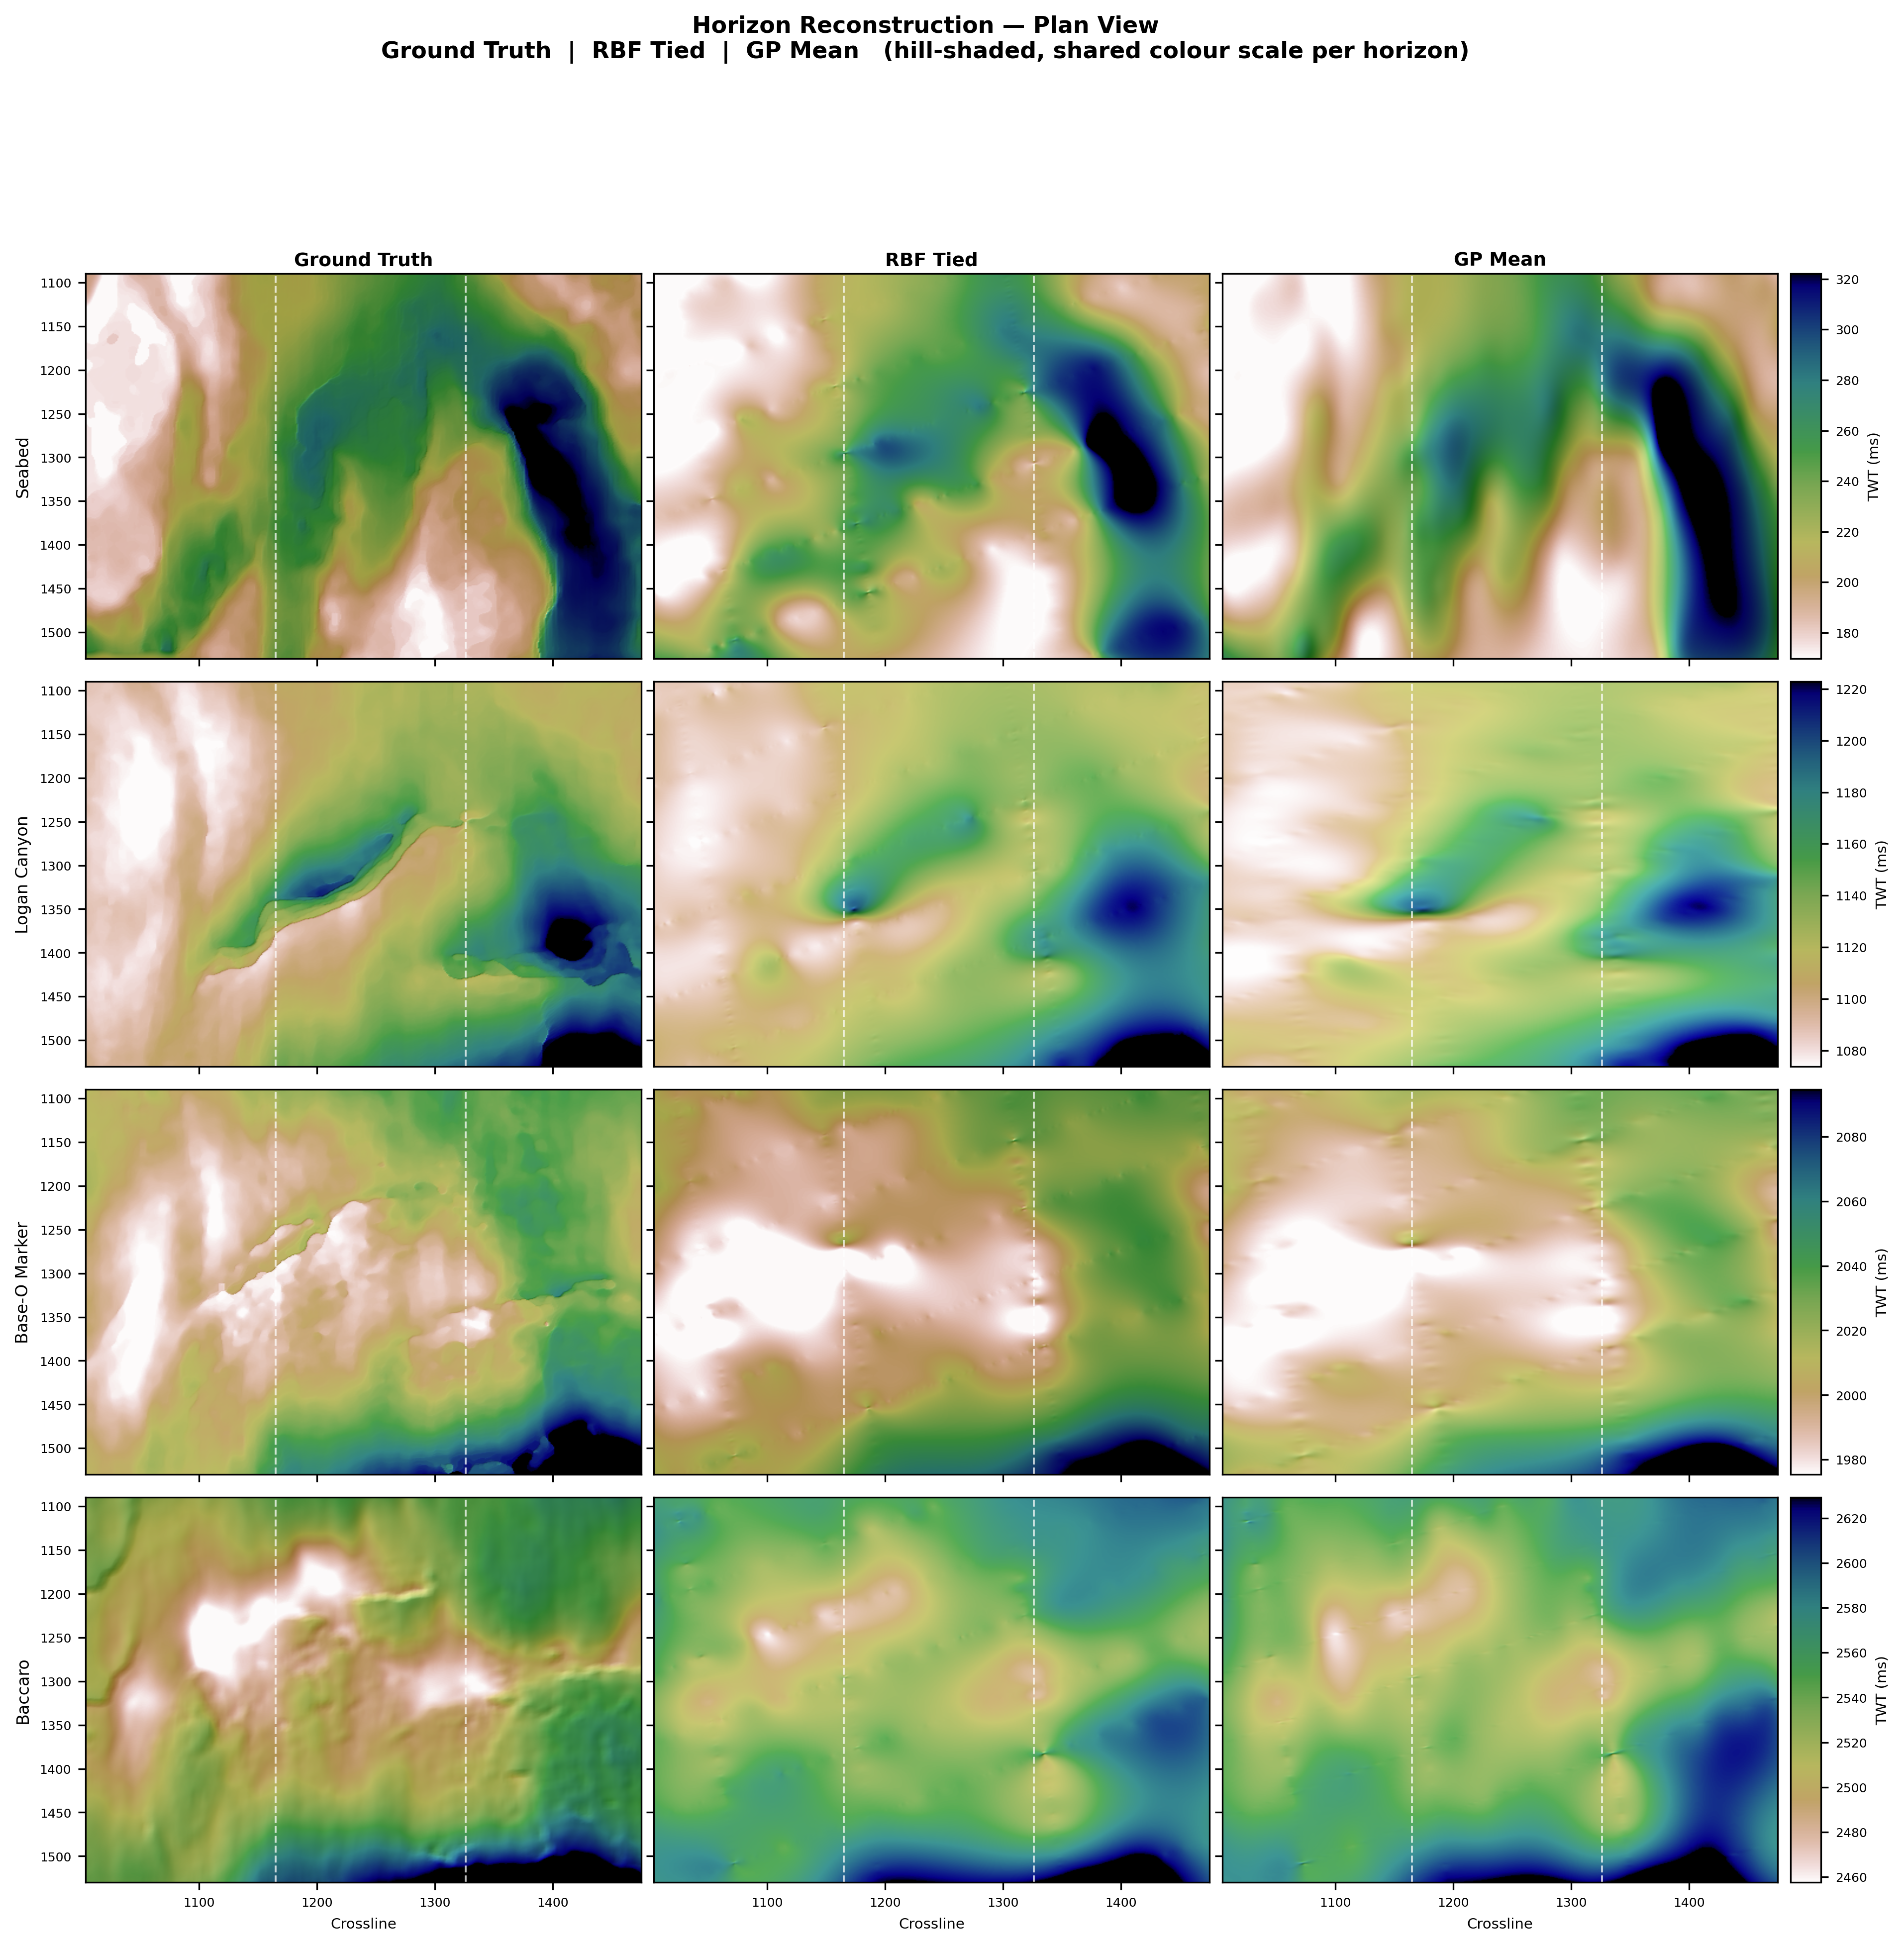
Plan-view two-way-time heat maps for all four horizons, hill-shaded for structural relief. Color scale is fixed per horizon across all three panels so the visual comparison is fair.
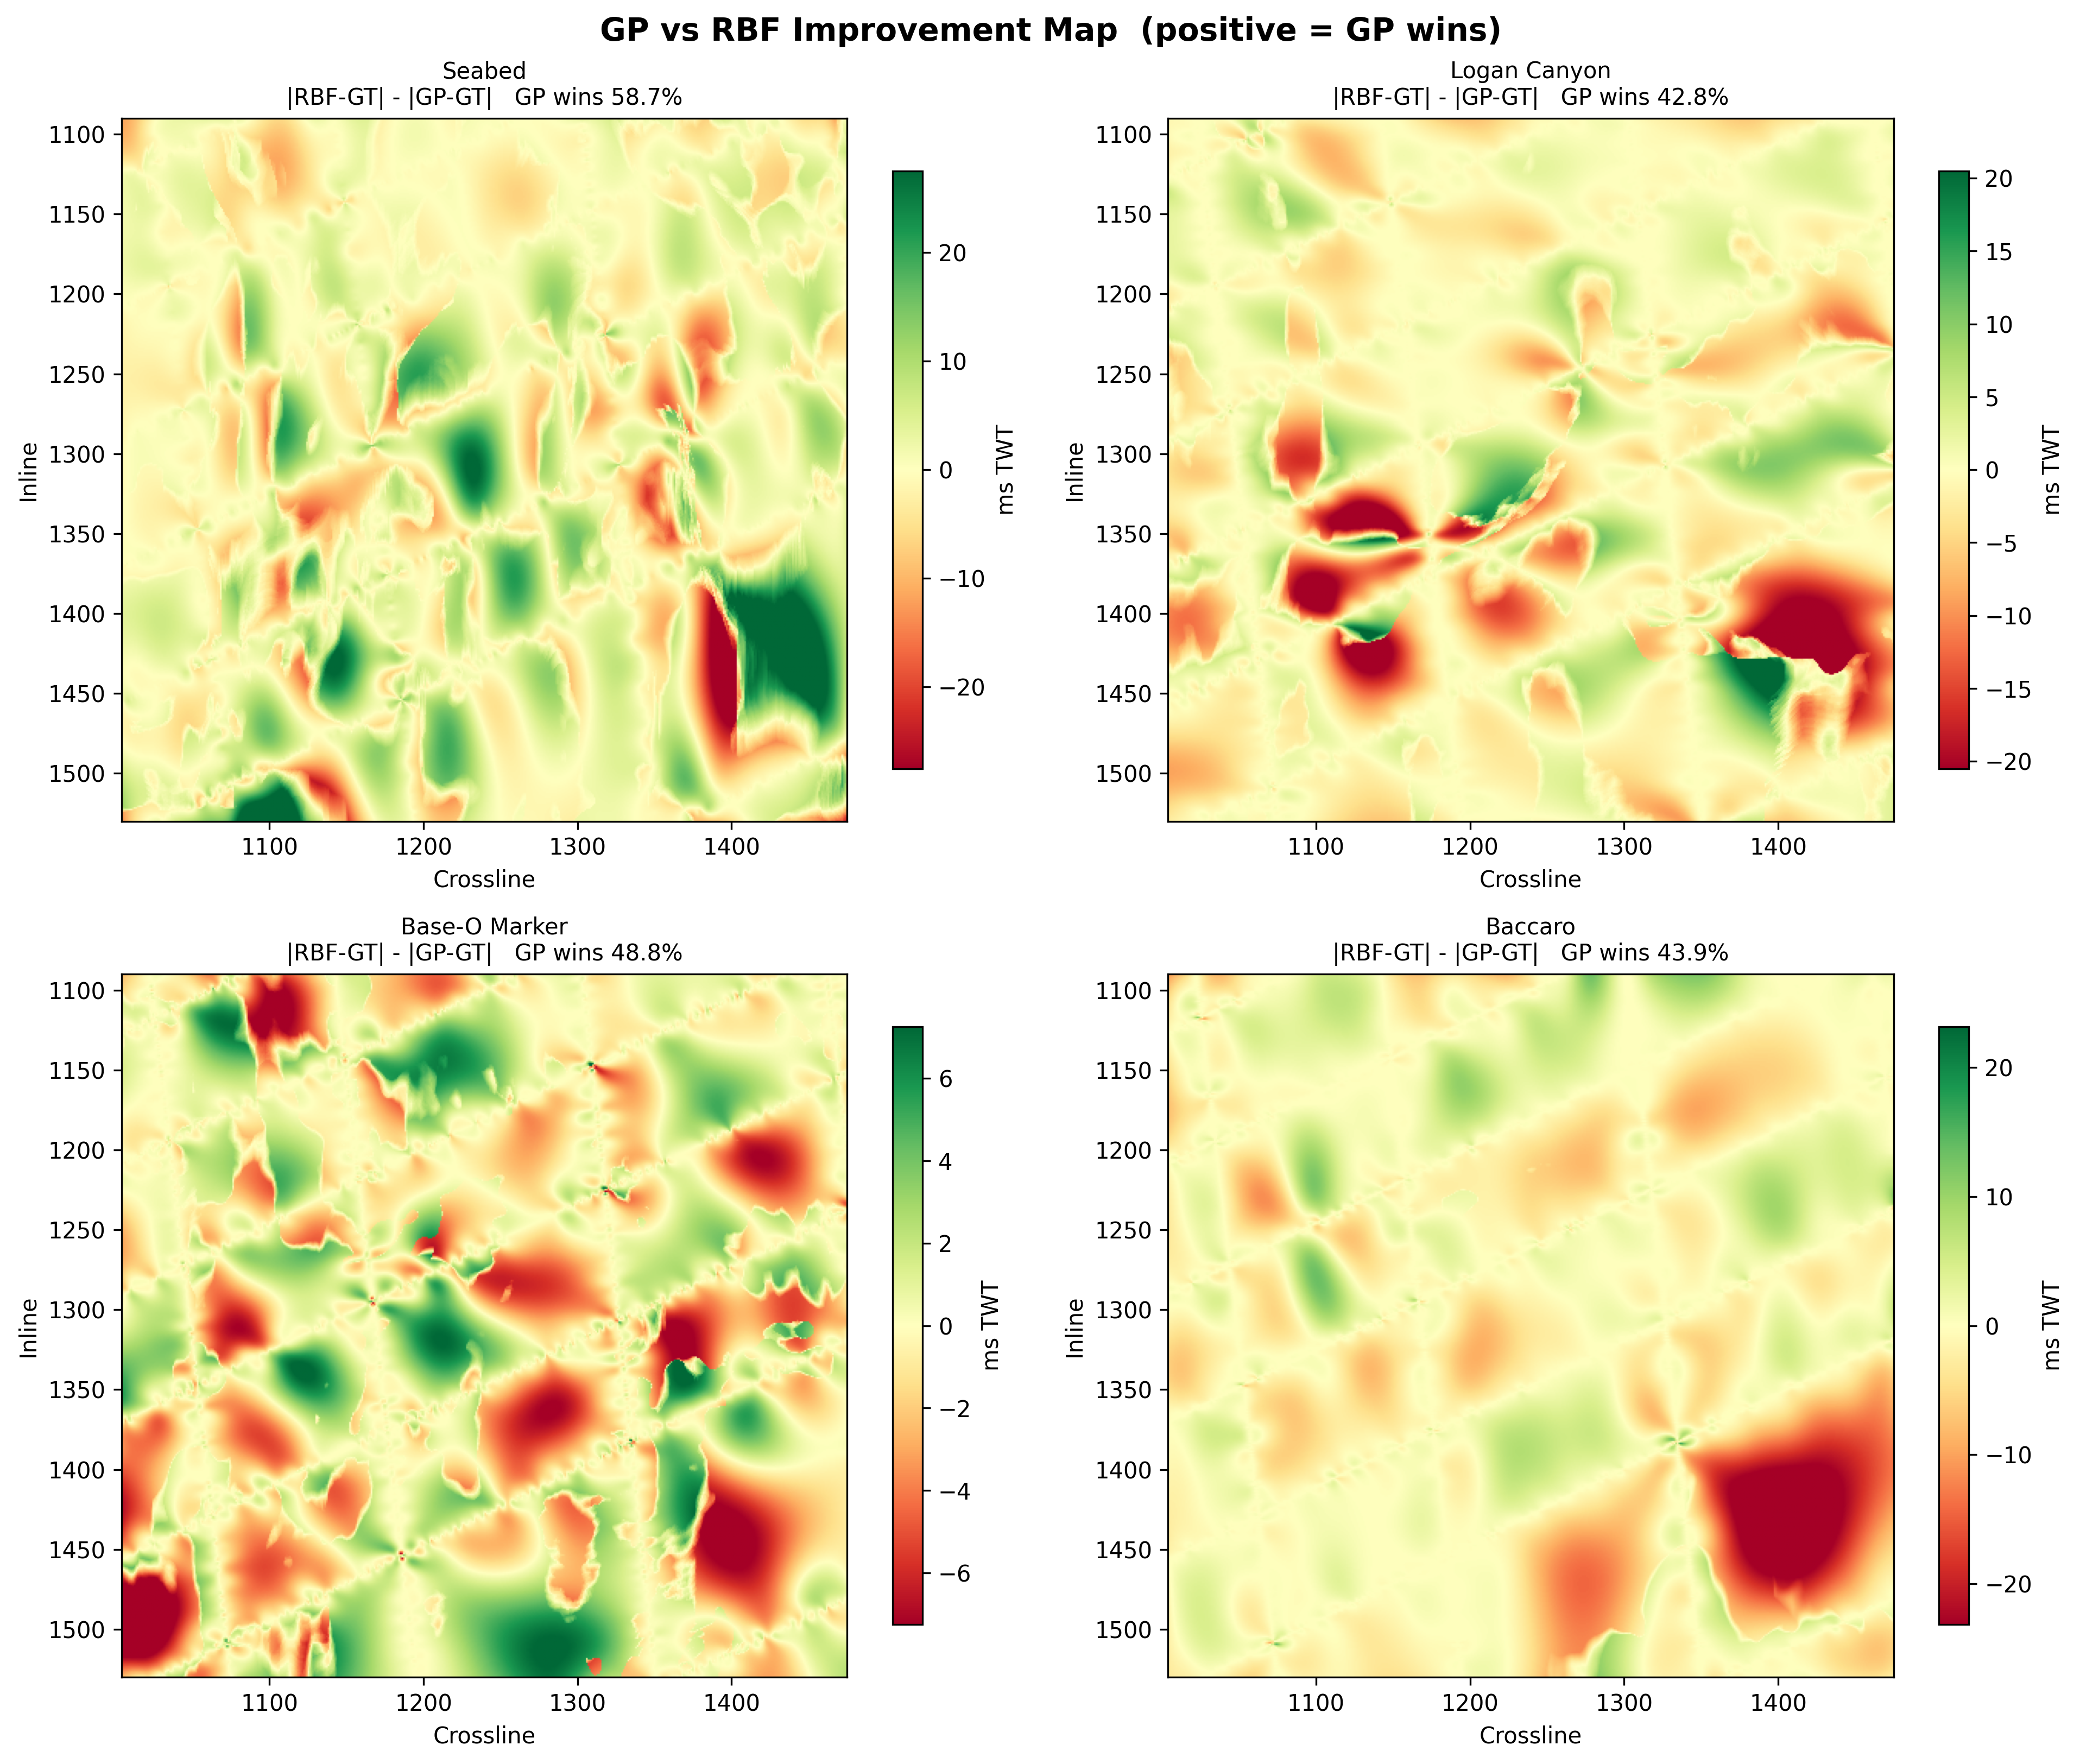
Error analysis
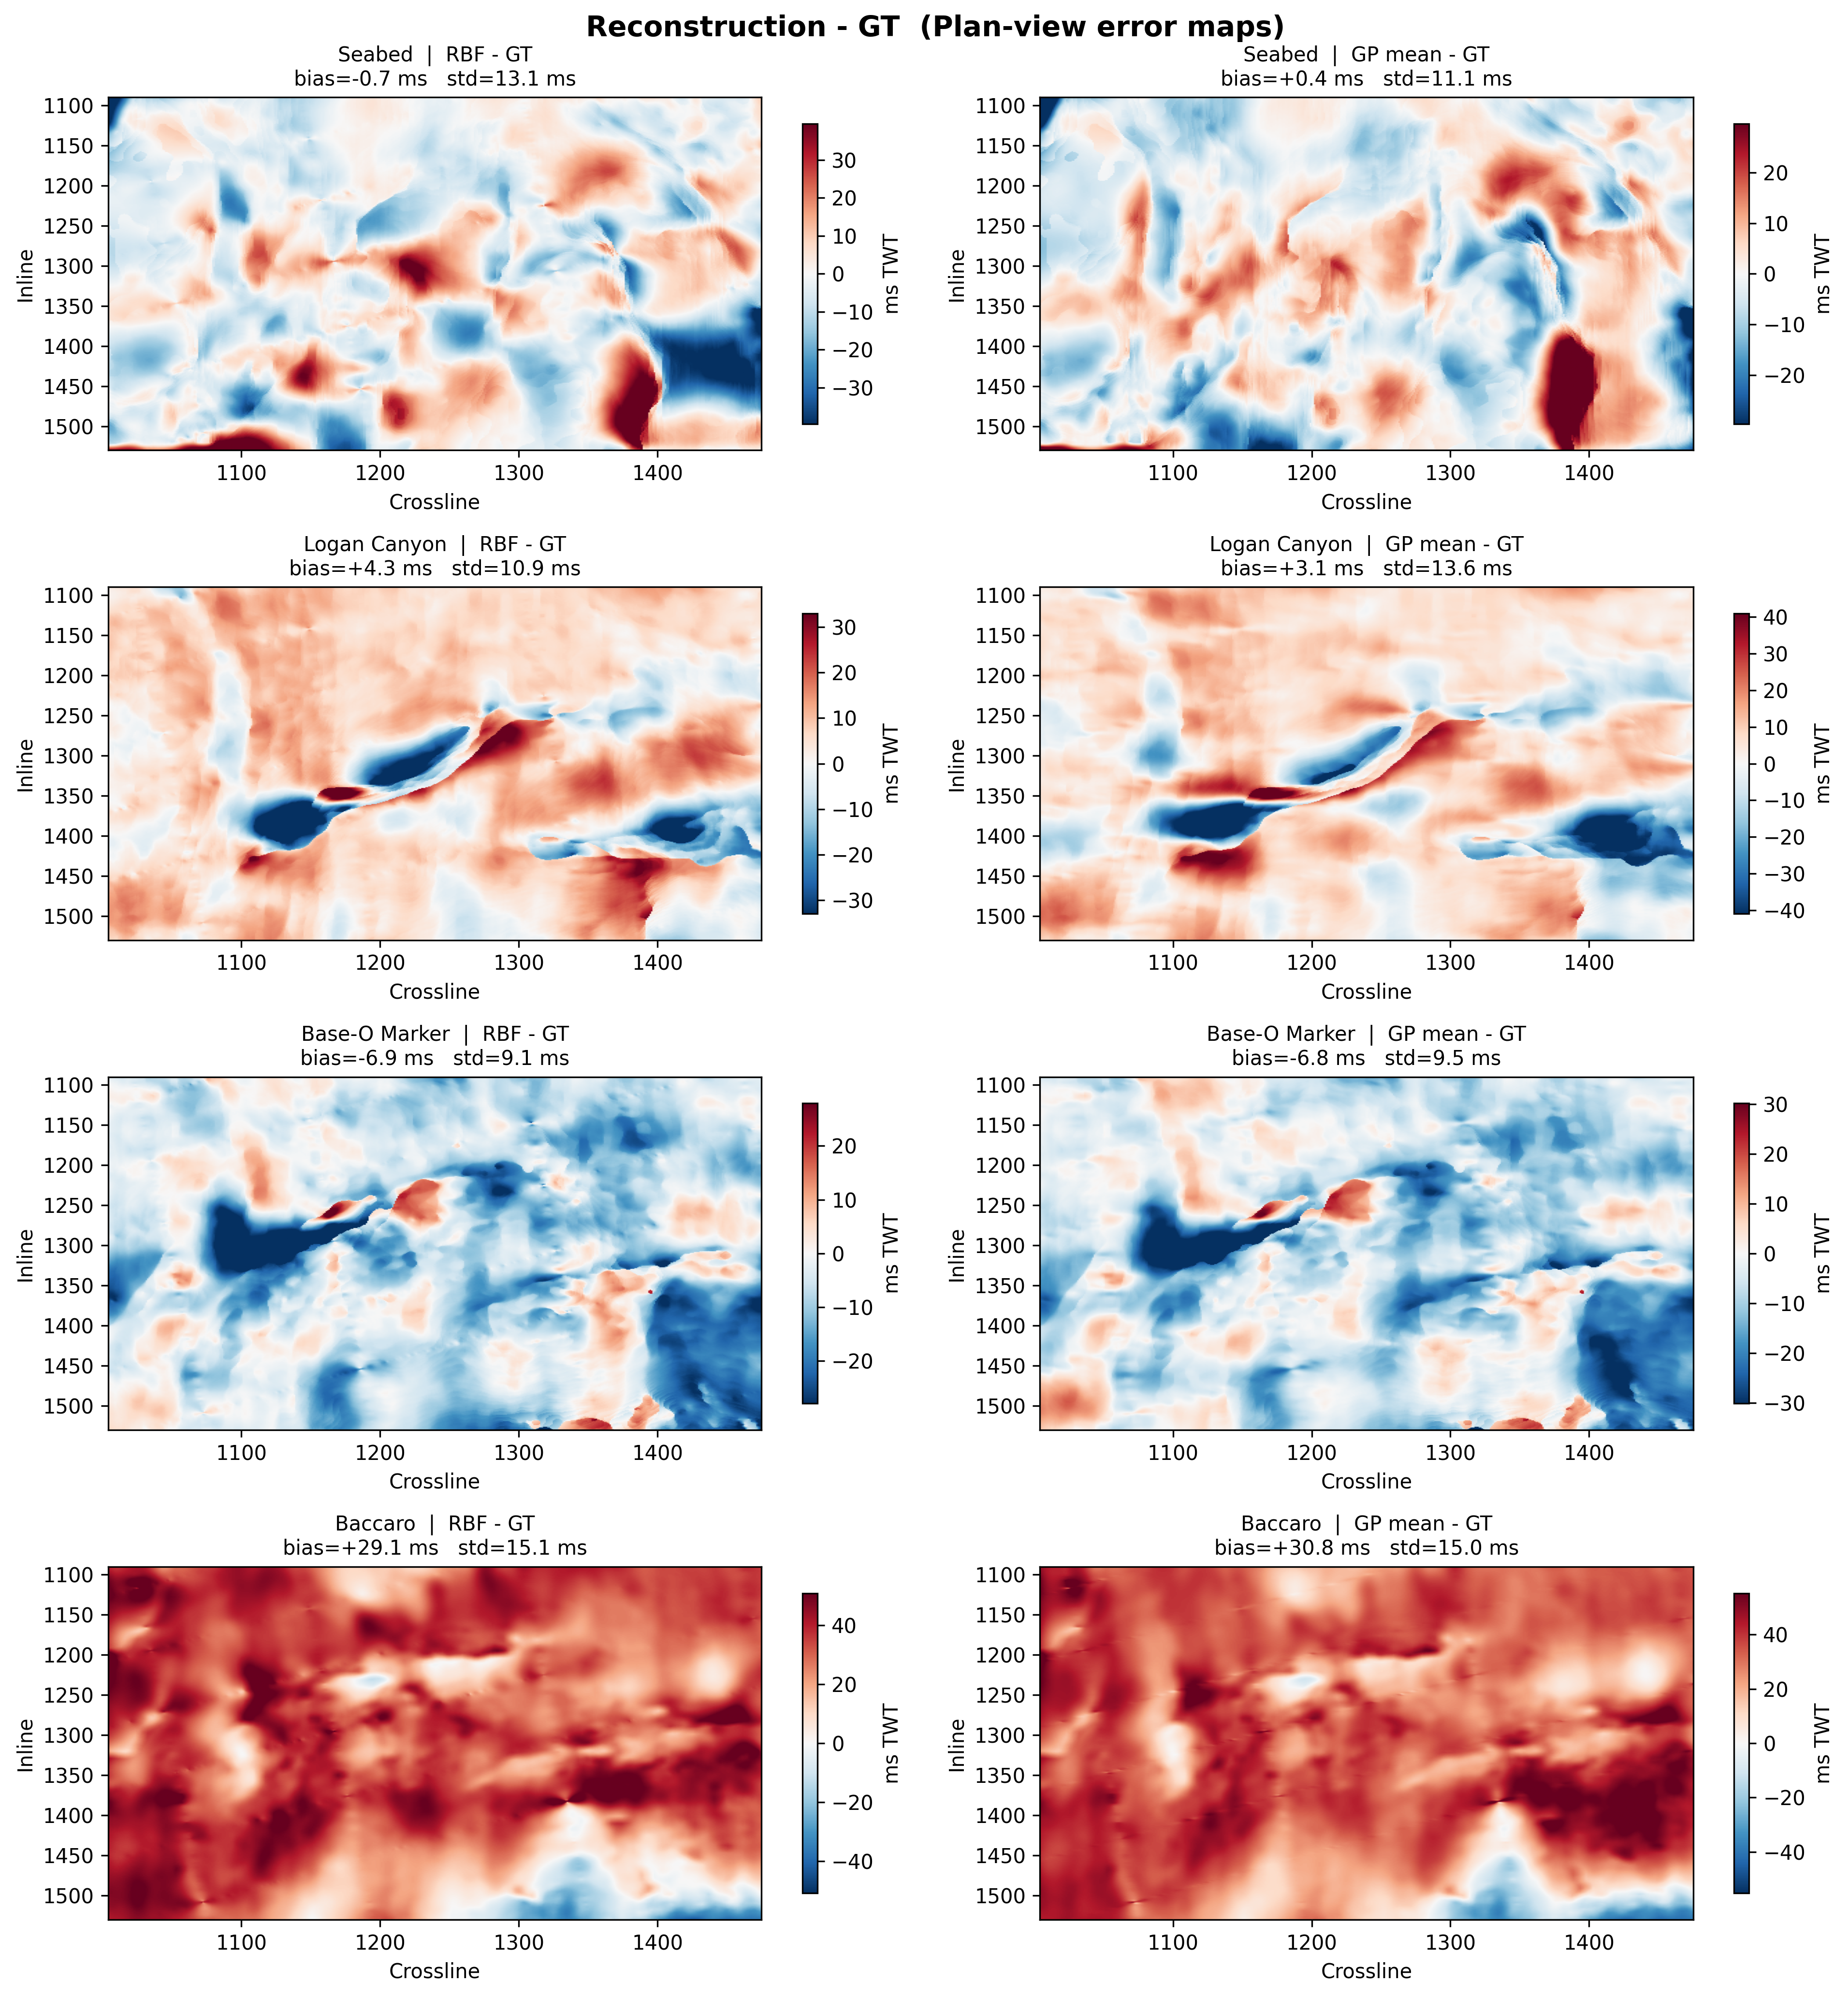
Per-pixel plan-view error maps (reconstruction − ground truth) for both methods. The summary statistics tell the story: GP and RBF perform comparably on three of the four horizons. Baccaro is an outlier on both methods, with a ~30 ms bias that traces back to the well-documented processing mismatch between the 2D and 3D acquisitions.
| Horizon | RBF bias | RBF std | GP bias | GP std | GP wins |
|---|---|---|---|---|---|
| Seabed | −0.7 ms | 13.1 ms | +0.4 ms | 11.1 ms | 58.7% |
| Logan Canyon | +4.3 ms | 10.9 ms | +3.1 ms | 13.6 ms | 42.8% |
| Base-O Marker | −6.9 ms | 9.1 ms | −6.8 ms | 9.5 ms | 48.8% |
| Baccaro | +29.1 ms | 15.1 ms | +30.8 ms | 15.0 ms | 43.9% |
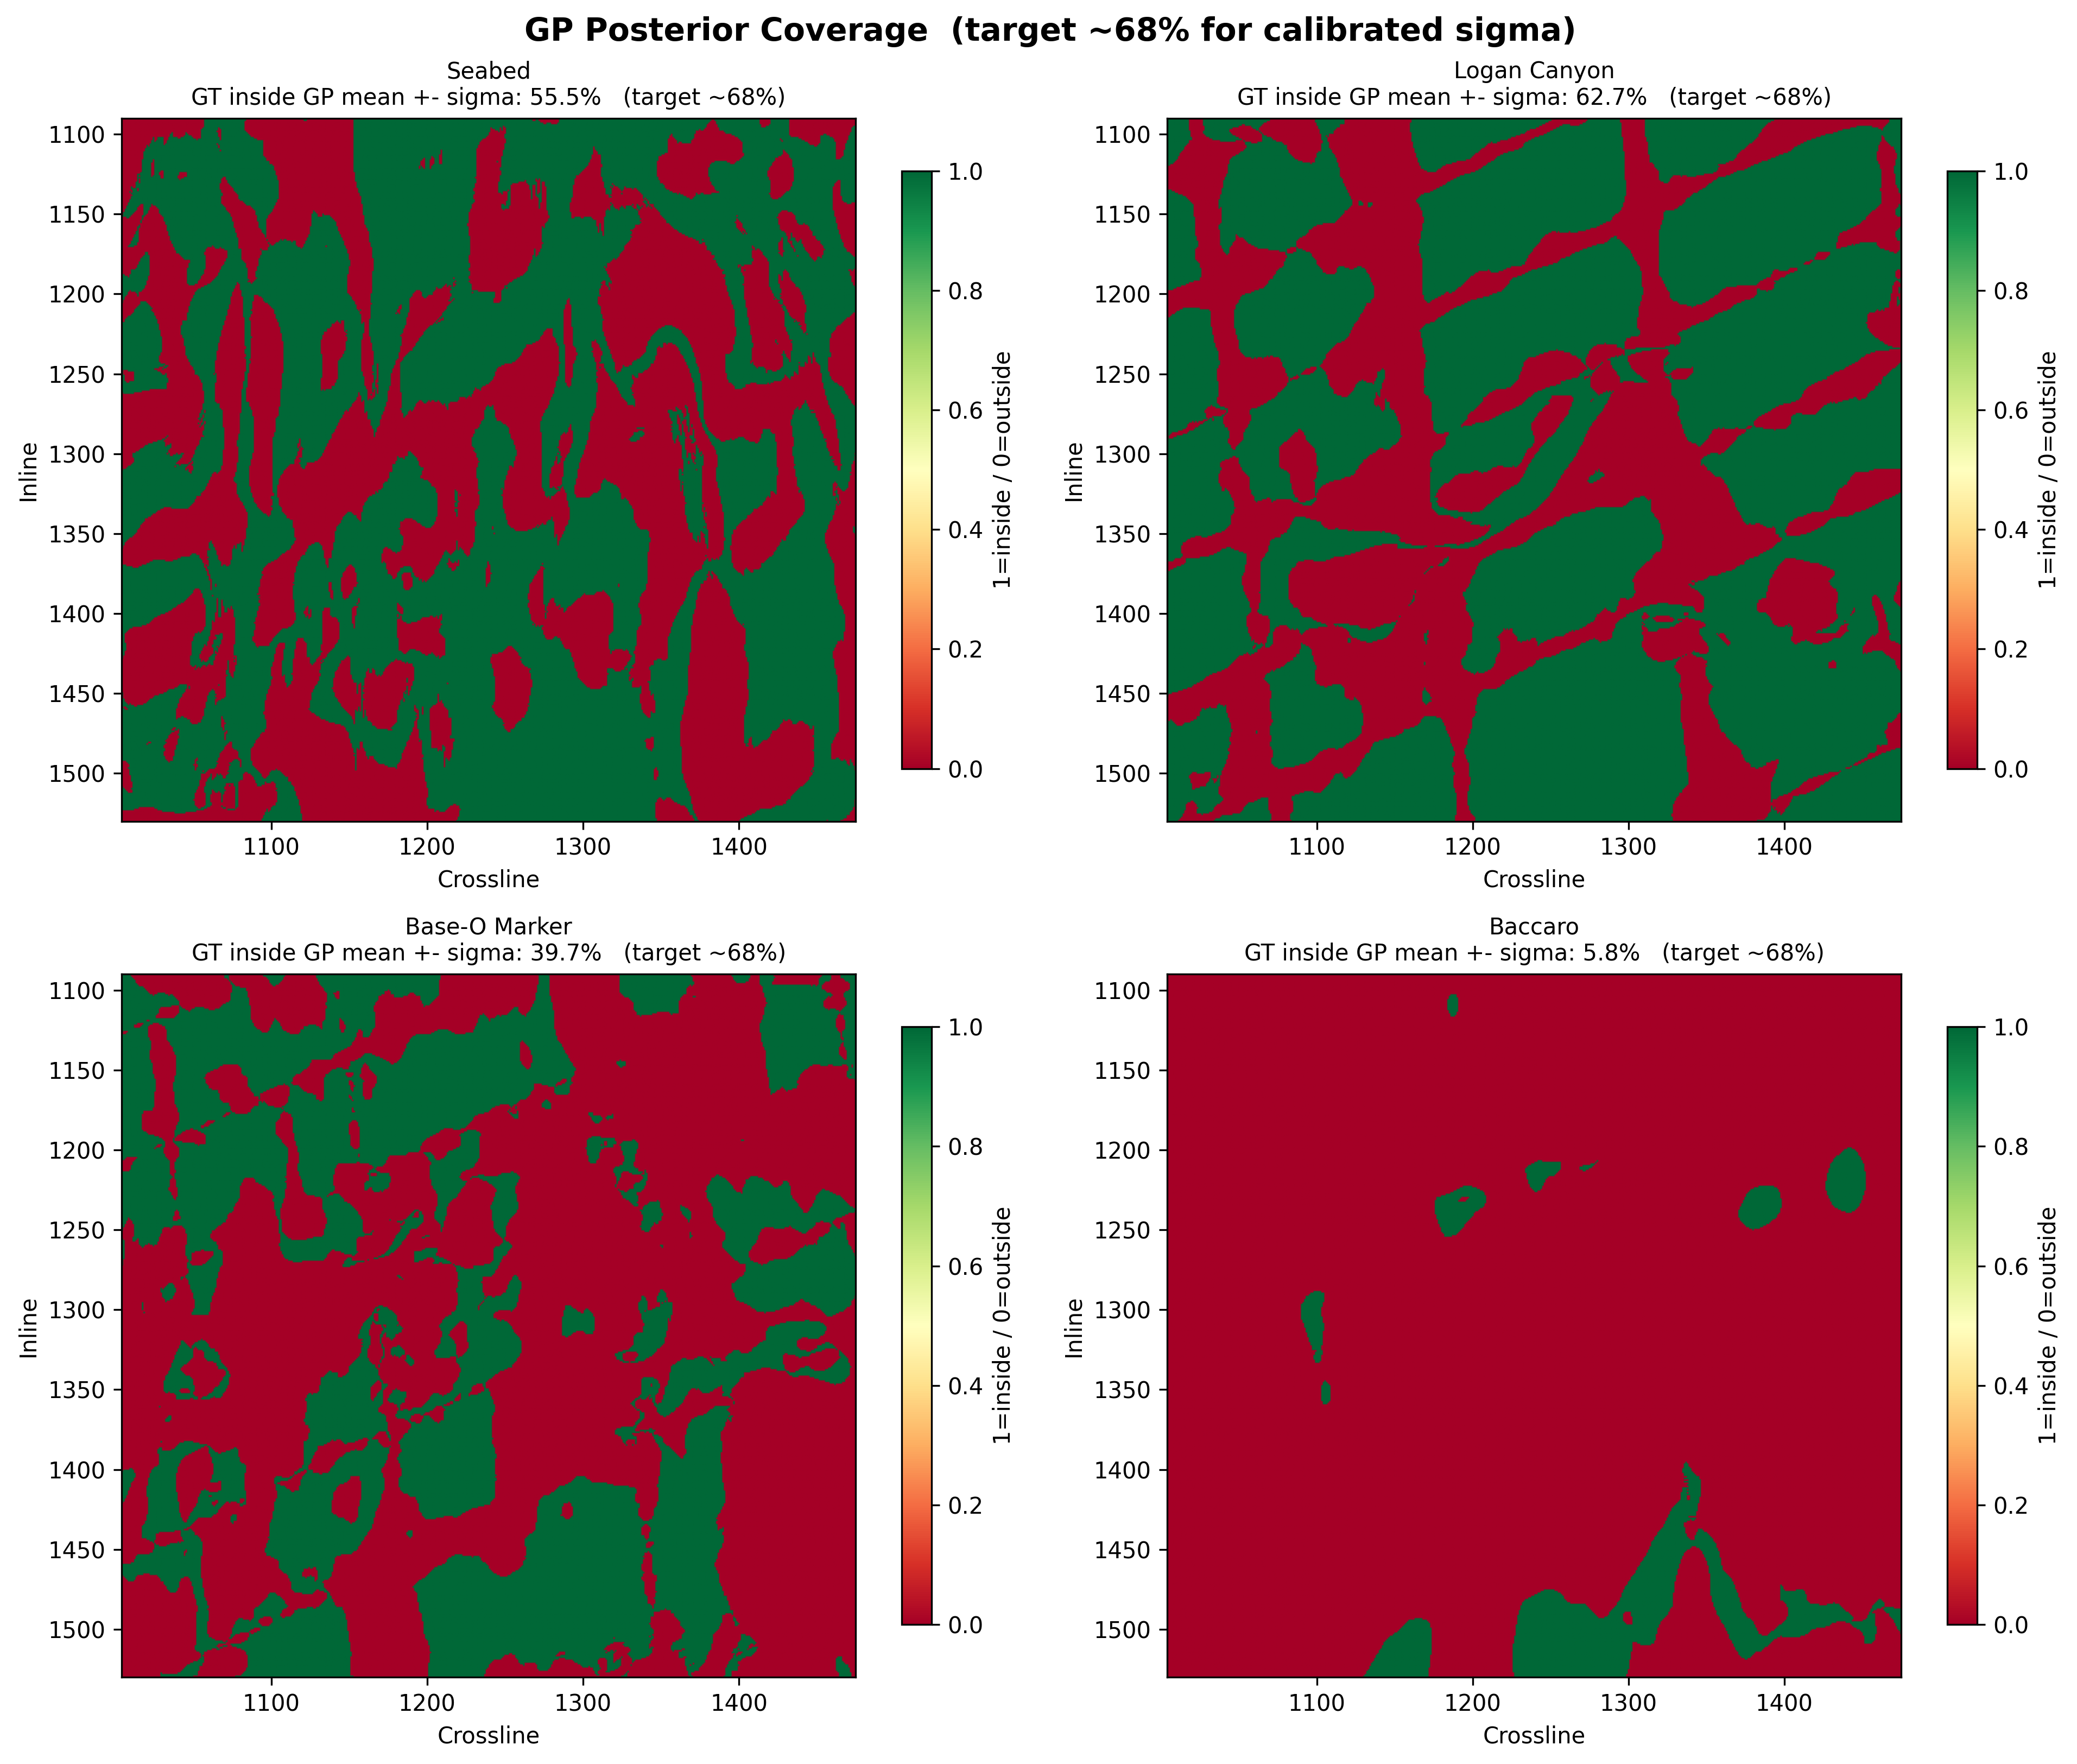
Calibration
A point estimate without a calibrated uncertainty is half a result. We test the GP's reported uncertainty by measuring what fraction of ground-truth points fall inside the GP mean ± 1σ band. For a well-calibrated posterior, that fraction should land near ~68%.
| Horizon | GT inside GP ± 1σ | Target | Reading |
|---|---|---|---|
| Seabed | 55.5% | ~68% | Slightly under-covered |
| Logan Canyon | 62.7% | ~68% | Close to calibrated |
| Base-O Marker | 39.7% | ~68% | Under-covered — σ too tight |
| Baccaro | 5.8% | ~68% | Badly under-covered — see limits below |
Honest limits
On Seabed and Logan Canyon the GP reconstruction is competitive with — and on Seabed clearly better than — the RBF baseline, with sigma calibration close to target. That is the expected signature of a working method on well-behaved horizons.
On Base-O Marker and Baccaro the GP posterior is too narrow: the reported uncertainty understates the actual error. The Baccaro miscalibration traces to a known systematic mismatch between the Penobscot 2D and 3D acquisitions (independent processing, ~12 ms median time shift, 4.7× amplitude scaling, different wavelets). Until that is corrected per-line, no reconstruction method should be expected to land its uncertainty bands honestly on Baccaro.
Penobscot answers one question: does the method work in principle when ground truth exists? The early answer is yes — on the horizons where the input domain is consistent. The same framework, deployed without ground truth, is addressed in the commercial deployment work.
Acknowledgments
Penobscot is a publicly released dataset made available through the Nova Scotia Department of Natural Resources. The 2D and 3D seismic data, well logs, and interpretations used in this case study are open-source and freely redistributable for research and demonstration.